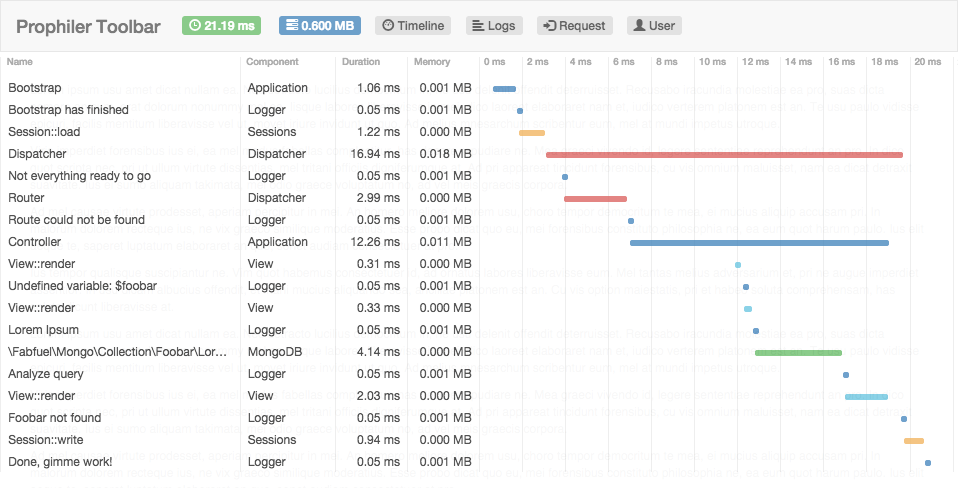
Visual candy to sweeten frustrating debugging work
Prophiler was built to provide a powerful tool for visualizing what's going on in your PHP
application. The timeline is inspired by modern browser's networking tabs and gives you a
beautiful and unique overview of processes happening in the background during the run of your
application. It's just the most beautiful PHP profiler out there.
Inspired by modern browser's network tabs, the timeline provides a unique, detailed and beautiful overview of what's going on under the hood.
With its PSR-3 compliant logger adapter, you can plug in Prophiler to your existing logging infrastructure and see all messages with a single click.
See exactly what queries and commands are processed by your MongoDB or MySQL database. In addition you get the execution time and memory consumption.


